
A guide to the Section 8 program. You’ll learn how to apply, how to qualify for a voucher and what it’s like to live in Section 8 housing.
by Maya Miller
What is Section 8 and how does it work?
The Section 8 Housing Choice Voucher program is a form of government rent assistance. In 2018, upwards of 5 million people across the country lived in a household that used a voucher to help pay some or all of their rent.
When Congress established Section 8 of the Housing and Community Development Act in 1974, one of the goals was to make sure people earning low wages could find “decent housing and a suitable living environment” outside of public housing units.
Today, people who meet income requirements can apply to the program to receive a voucher when they become available. If they are approved, selected and then find an apartment or house with the voucher, their local housing authority starts sending payments directly to landlords.
The payments cover some or all of the voucher holder’s rent. On average, each household will pay somewhere between 30% and 40% of its income on rent.
We found that good information about Section 8 is not easily available.
Propulica spent some time reporting on how Section 8 is working as part of a series on housing with the nonprofit news organization The Connecticut Mirror. We learned that the process of getting and using a voucher to find housing is still filled with information gaps.
“Half the battle is the information piece,” said Josh Serrano, a voucher holder in Hartford, Connecticut. He and his colleagues run know-your-rights workshops for potential voucher holders.
“If you don’t know the law you can’t obey the law,” said Crystal Carter, who received a voucher through a Connecticut housing authority but struggled to find housing. She said the companies and landlords she worked with did not always know the Section 8 laws and processes, and that created problems during her housing search.
To create this guide, we spoke with dozens of people who have navigated the voucher process, as well as with property brokers, landlords, former housing authority workers, housing lawyers and housing advocates.
This guide will tell you:
- How to find out if I should apply for a Section 8 housing voucher
- How do I apply for a Section 8 housing voucher
- How do I find housing with a Section 8 housing voucher
- Living with a voucher
- Other Resources
How to find out if I should apply for a Section 8 housing voucher
To get Section 8 housing, you will need to apply for a voucher.
Before you apply, you will need to know:
-
Where you want to live: Each local housing authority has different rules around Section 8. Decide where you want to live and then find the local housing authorities that are in charge of those neighborhoods. You can find a list of all the housing authorities here. Keep in mind: You can apply to housing authorities even if you don’t already live in that town. Don’t see the town you are looking for? Try looking for a regional or state housing authority.
-
How much money you and your household are making: The program is reserved for people making a certain amount of money compared with the area. Check out the housing authority’s income requirements. Then, go to the Department of Housing and Urban Development’s online tool to see whether you — and the people you’re living with — fit into that category.
-
Immigration status for you and everyone you’ll be living with: At least one person in your household needs to have legal documentation to be living in the U.S. for the household to apply for a voucher. The nonprofit organization Affordable Housing Online has detailed information here.
-
Criminal history for you and everyone you’ll be living with: All housing authorities do background checks, but each one has different rules. It is possible to get approved for housing if you have a felony or if you are on parole. Ask the specific housing authorities by calling or emailing to see if you’re still eligible. IMPORTANT: You CANNOT get a voucher if you, or someone in your household, is on a lifelong sex offender registry, has been convicted of producing methamphetamine in federal housing or has been evicted within the past three years for drug-related reasons.
How do I apply for Section 8 housing voucher?
The first step to applying for Section 8 housing is to tell the housing authority you’re interested. But, there are more people who want vouchers than there are vouchers available. Most of the time, you’ll be placed on a waitlist.
Getting on a waitlist:
-
Get an email account. You will need an email account to apply. To create a free one, sign up for Gmail or Yahoo accounts.
-
Get alerts. You can sign up for services that will email you when housing authorities open waitlists. Affordable Housing Online has a website where you can see which waitlists are open. The group also has a webpage where you can sign up to get email alerts from the state you’re interested in living in. Some housing authorities have their own alert systems. If you absolutely know that you only want to live in one neighborhood, find the housing authority that oversees the area and sign up with that housing authority directly.
-
Be flexible. Apply to as many waitlists as you can, as long as you can see yourself living in that neighborhood for at least 12 months. After a year, you can look into moving while still holding onto your voucher.
-
Use a dependable mailing address. If you move around a lot, or are homeless, give the housing authority the mailing address of a friend or family member who can let you know when mail arrives for you. You can also ask local churches and shelters if you can use their mailing address. If they say yes, check in with them once a week to see if they’ve gotten any notices from the housing authority.
-
Do not pay money to apply. You never have to pay to apply to a Section 8 waitlist, and there is no way to pay to move up the waitlist once you’re on it. If you’re asked to pay, it’s more than likely a scam.
-
A doctor’s note can speed up the wait. Some housing authorities move you up the waitlist if you or someone in your household has a disability or a health issue like asthma that is getting worse because of where you’re living. If these cases apply to you, ask a doctor to write a note to the housing authority explaining how new housing will help your condition. Get and keep a copy of the note.
Steps to take while you’re on a Section 8 waitlist:
Lawyers and former housing authority workers say that being on the waitlist doesn’t mean you should just wait until you hear something. They shared a couple of important tips:
-
Take notes and photos. Keep a written record of all your communication with the housing authority. You can use your phone to take pictures of documents, emails you send or notes you take while having a phone call. Record keeping is important because there is a lot of staff turnover within housing authorities, lawyers and former employees told us.
-
Keep in touch. Respond to any notices you get in the mail from the housing authority over phone, email or mail so the housing authority knows you’re still interested in staying on the waitlist.
-
Keep applying. As soon as new waitlists in your state open up, apply. Don’t wait!
-
Join communities online. Join Section 8 groups on social media platforms. Tens of thousands of people are in the same position you are, and they have created social networks to support and help one another. Here are some of the more popular nationwide Facebook groups: Public Housing (Section 8) (Voucher Holders) HUD Tenants Group and Housing Choice Voucher (Section 8) Friends.
-
Be patient. It can take months or years to get approved depending on demand. Don’t give up!
-
Keep everyone updated. Communicate with the housing authority if there are any changes in where you live, how much money you or someone in your household is making or how many people are in your household (for example, if you get married or divorced, or adopt or have a child).
What to do after being approved for a Section 8 housing voucher:
-
Be your own advocate, and ask questions if you have them. If you are missing information or have questions, you can call or email the local housing authority. It’s a complicated process, and it’s important to speak up for yourself when you don’t understand something. The housing authorities also have walk-in days where you can stop by and ask questions.
-
Hand in the paperwork on time. If you miss the deadline, your move could be delayed.
-
Don’t miss the housing authority “briefing.” All housing authorities are required to offer in-person briefings to provide you with the information you need to know before you get your voucher. You’ll get a notice in the mail that will tell you when and where the briefing is taking place. If you can’t make the briefing for any reason, be sure to contact your local housing authority. Some housing authorities give you the vouchers the same day you receive a briefing, and others hand them out a couple days or weeks later.
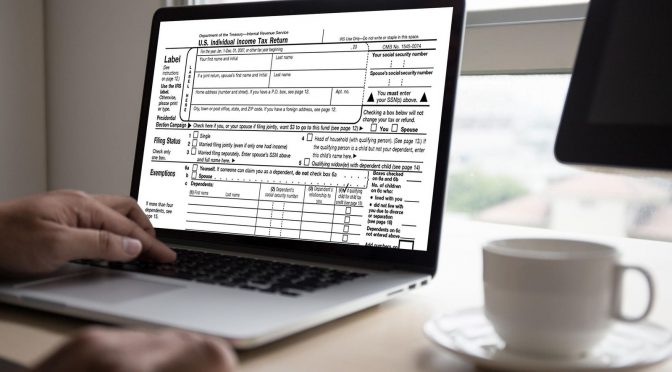
How do I find housing with a Section 8 housing voucher?
Once you have your voucher in hand, you should start looking for an apartment. First you get the voucher. Here’s what a voucher looks like. Yours may be different.
What to know about the voucher:
-
Check the number of bedrooms, and ask the housing authority about the rent. The voucher comes with a limit on how many bedrooms the apartment can have. The voucher does not come with a set amount of rent. So, before you start your search, you should talk to your housing authority worker about what the range of rent might be.
-
Calculate the cost of gas, electricity and other utilities (like heat). We’ve heard stories of people who ended up with hard-to-pay utility bills because they didn’t consider their cost. If you’re unclear about your utility allowance, get in touch with the housing authority or a local housing advocate.
-
You are responsible for the security deposit. Ask the property owner or landlord how much the security deposit is while you’re looking for housing because you’re ultimately responsible for paying it. You can also check whether your state security deposit assistance programs can help cover the deposit by looking up “deposit assistance program” in a search engine like Google or asking your housing authority.
Tips for the housing search:
-
Almost everyone we talked to said that it is important to document everything. Write everything down, and bring someone with you who can help take notes on your search process. You can also take pictures of everything with your phone. Here are the things you should write down:
-
The dates, times and places where meetings happen.
-
Names and job titles of everyone you meet.
-
The address of the apartment or house you want to rent, and the type of building.
-
IMPORTANT: If you are denied housing, write down the reasons you were turned down.
-
Look for housing online. HUD compiled a list of all the apartment buildings it has worked with through Section 8 and put it into a map that you can scroll through. Otherwise, you can look through:
How to apply for an apartment or house:
Once you’ve found an apartment or house that fits your needs, you should apply for a lease.
-
Submit your paperwork to the landlord. Make sure the paperwork is filled out and returned to the housing authority. You’ll get this paperwork, which includes a “request for tenancy approval,” when you get your voucher. Make sure the housing authority gets the “request for tenancy approval” and a copy of the lease.
-
Read the lease carefully. Ask questions if you don’t understand something. Housing lawyers have told us these leases can be complicated, hard to understand and can include loopholes that put you at a disadvantage. They recommend that you read through the lease alongside a housing authority staff member, housing advocate or local lawyer before deciding whether to sign.
-
Keep inspections in mind. Within a few days or weeks of the lease signing, the housing authority will set up a time to inspect the place to make sure it’s in good condition. Once everything passes inspection, you can move in.
What can go wrong:
-
The time limit. From the moment you get your briefing, you’ll have at least 60 days (it can be 90 or 120 days, depending on the housing authority) to find housing. It’s normal for people to struggle to find housing in that time frame, especially if the person is working long hours.
-
If you have trouble finding housing in that time, you can ask the housing authority for an extension. “Do it earlier rather than later,” said Erin Kemple, the executive director of the Connecticut Fair Housing Center.
-
The housing authority will give you an extension so long as you can show them that you’ve put in effort to find housing. So, write down and take pictures of all the places you visit on your housing search and when you visited them (including the date and time).
-
-
Housing discrimination. In the 40-plus years that vouchers have been around, research shows that local zoning boards and property owners have made it hard for people with vouchers to live in certain areas.
-
Some states have responded with laws to address this practice. As of December 2019, there are 14 states that have passed laws banning landlords from rejecting tenants based on their source of rent income, which includes Section 8 vouchers. If you come across a housing listing that says “No Section 8” in one of these states, report it to the local housing authority and to legal aid or fair housing attorneys in your state.
-
If it feels like the only reason you’re NOT allowed to apply for an apartment is because you have a voucher, make sure to document it and then tell your local housing authority about the incident.
-
Living with a voucher
We’ve heard from people with plenty of experience in the Section 8 process. Overall, they’ve told us it’s just like living in other apartments. But there are some challenges that come up when living with a voucher that folks regularly brought up.
Here is what you need to know about living in Section 8 housing:
-
No matter what, always pay your portion of the rent on time. Always ask for receipts of your payment, and keep them on file.
-
Get everything in writing. If your landlord reaches out and tells you that you need to pay for a repair, ask for a written explanation. If you don’t think you should be paying what the landlord is asking for, reach out to the housing authority, a local housing lawyer or a housing advocate for advice.
-
Moving with a voucher. If you have lived in the same place for at least 12 months, you can move to a different neighborhood or state while keeping your voucher. This is called “porting.” You must apply. HUD has trainings and forms for porting that you can check out.
-
Unless a family breaks up, you can’t pass along a voucher to somebody else. The voucher can stay within the household if the person carrying the voucher dies, divorces or is convicted of a crime. You can’t pass along vouchers in a will or sell them.
Other Resources:
- Lists of local, state and federal laws around housing discrimination
- HUD’s detailed guidelines on what income you should think about when figuring out what your household income is
- HUD’s detailed guidelines on calculating rent once you get a voucher (plus some more details on figuring out your family’s income)
- A Section 8 guide with extra tips for people with disabilities
Republished with permission under license from ProPublica.
How to Apply for Section 8 Housing
If you legally reside in the United States and don’t make enough money to pay your rent or mortgage, you might qualify for Section 8 housing, also known as housing choice vouchers. Although applying for government assistance can be difficult, receiving the voucher can be a big help when you’re in a tough financial situation.

Understand how Section 8 housing works. Housing choice vouchers are administered by local public housing authorities (PHA), of which there are several around the nation. Vouchers come as either project-based or tenant-based — see below for more details. The Department of Housing and Urban Development (HUD) supports PHAs, and your local PHA will help you arrange Section 8 housing.
- Under a tenant-based voucher, a tenant gets a voucher and can move into a unit with financial assistance. If that tenant chooses to move to another unit, the voucher carries over to the next unit, offering continued assistance to the tenant wherever they decide to live.
- Under a project-based voucher, a tenant gets assistance so long as they remain in the unit that the voucher was issued for. The voucher lasts for a specified unit and time. If the family chooses to leave the unit, the assistance does not carry over to the next unit. A family may still, however, be eligible for a tenant-based voucher.

Determine your eligibility. Whether or not you qualify for Section 8 housing is based on multiple factors, including your family's income, the median income in your area, how much rent you're paying, your assets, and the composition of your family. Here's a general breakdown of the eligibility requirements:
- You are a US citizen or non-citizen who has eligible immigration status.
- You earn, as a family, less than 50% of the median income for the county or city in which you choose to live.[1] In fact, most Section 8 recipients earn closer to 30% of the median income for the county or metro area in which they choose to live. That's because the PHA must provide 75% of its vouchers to families who earn less than 30% of the median income.
- You meet other criteria based on assets and family composition.

Document your income and housing costs. Have pay stubs from your employer verifying your salary, and either your mortgage information or something in writing from your property owner that confirms your current rent. You'll need these documents to apply for vouchers.

Know what kind of voucher you need. HUD provides assistance to both renters and homeowners. Apply for a tenant voucher if you rent the premises where you’re living. Complete a property voucher application if you would like financial assistance with paying a mortgage for a condominium, townhouse or home that you own. In some cases, Section 8 vouchers can be used to purchase a modest home and make mortgage payments.

Apply for vouchers. Contact your local PHA to begin the application process. Find a list of PHAs here. Ask if it's possible to complete the forms online.
- Get assistance with completing the necessary paperwork if you’re not fluent in English. Call your local public housing authority to find out their office hours so you can complete the paperwork in person. You should be able to schedule a time with someone who can translate or to help you complete the forms
Enrolling in Section 8 Assistance

Be prepared for a long wait. In many cases, people who apply for Section 8 are waitlisted. Your local PHA may have more applications than it can afford to approve vouchers for, and will therefore have a waiting list for applicants.
- In some cases, there are as many as 100,000 applicants for only 10,000 spots. It can take upwards of 3 to 6 years in these areas to be enrolled in Section 8 while on the waiting list.[2]
- Be aware of prioritizing. PHAs develop local preferences for moving applications up or down the waiting list, and may give preference to families who are currently homeless or living in substandard housing, families who pay more than 50% of their income in rent, or families who are involuntarily displaced. Inquire at your local PHA office if you have any questions about how prioritizing is allotted.
- If the PHA in your area has more applicants than it can assist in the near future, it may temporarily stop accepting new applications.[3] Although this type of closure is not permanent, it may be beneficial to look for Section 8 housing in another county or metropolitan area if your local office is not open to new applicants.

Know your responsibilities if you do get accepted. If your local PHA does approve your application and provide you with a housing voucher, you'll need to make sure that your current or intended living situation fits HUD health and safety requirements.
- Safety requirements include appropriate thermal controls, running water and sanitation systems, lack of toxic building materials, and structural integrity among other criteria.
- If you're renting, you'll be required to sign a year lease with a cooperating property owner, who will be obligated to both you and your local PHA to provide safe housing and reasonable rent.
- You'll also be required to make payments on time, maintain the unit in good condition, and comply with the terms of the lease. If you fail to pay the landlord on time, your Section 8 assistance could be revoked.

Calculate your rent responsibility. Under Section 8 housing, you and your family will pay 30% of your monthly adjusted gross income on housing and utilities. Your voucher will cover the remainder of the cost. Your local PHA can help you calculate how much you need to budget for each month.
- Say, for example, your monthly income is $1,000. You'd pay $300, even if the rent of the unit is $1,000. There will likely be a cap on the maximum amount the voucher can pay based on the cost of living in your area.

Avoid housing discrimination. A landlord may legally refuse occupancy for failure to pass background checks, poor credit, and other determinations, but cannot refuse occupancy to you based solely on your Section 8 enrollment.[4] Nor can a landlord charge a section 8 voucher holder more than a non-section-8 tenant.[5]
- If you think a landlord has refused occupancy to you based solely on your Section 8 enrollment, contact your local PHA.

Know what role geography plays in Section 8 enrollment. Section 8 guidelines are different from location to location. But in general, residents who receive a tenant-based voucher for the current jurisdiction in which they live may use that voucher to live anywhere in the country. Residents who do not live in the same jurisdiction in which they applied must move to the jurisdiction that issues the voucher for at least 12 months; after 12 months, they are free to move.
- Section 8 vouchers can also help you buy your home by getting a home loan at below-market interest rates. This enables you to use your voucher as a credit toward your mortgage rather than rent. Consult your local housing authority for more information.[6]

Don't commit fraud. Fraud can result in termination of Section 8 assistance, as well as restitution of funds, probation, or even prison.[7] Fraud may be defined as any of the following offenses:
- Knowingly omitting or under-reporting income or assets from household income.
- Transferring assets or income to achieve eligibility.
- Falsifying or using false Social Security documents.
- Falsifying the number of members in your household.
- Getting assistance on top of Section 8 without notifying the appropriate parties
- Renting out or subletting all or part of the unit.
- Charging rent from any tenants who may be living with you.
Tips
- You can move without losing your access to Section 8 housing. Be sure to notify your local PHA in advance, terminate your lease within lease provisions, and find new housing that fits within HUD health and safety standards.
- Expect to wait before you hear a final determination on your application. Many Section 8 housing applicants are on waiting lists for months and even years.
- Note that landlords must return any deposits held if the unit doesn’t pass the HUD inspection, and they have the right to turn away an applicant if the inspection cannot be completed within 10 days.
- Click here to contact your local PHA. You can find the nearest HUD office here
Warnings
- Don’t get tricked by professional scammers. There are fraudulent companies promising to help you complete the paperwork for Section 8 housing in return for a fee. You can get all the assistance you need to file for Section 8 housing free of charge simply by contacting the federal HUD office or your local public housing authority.
- This article contains legal information, but does not constitute legal advice. If you feel that you need legal advice, consult an attorney.
References
- http://portal.hud.gov/hudportal/HUD?src=/program_offices/public_indian_housing/programs/hcv/about/fact_sheet
- http://www.insidebayarea.com/ci_17060183
- http://portal.hud.gov/hudportal/HUD?src=/program_offices/public_indian_housing/programs/hcv/about/fact_sheet
- http://www.masslegalhelp.org/common-forms-of-housing-discrimination
- http://www.tenantsunion.org/en/rights/section-8-vouchers
- http://www.chfa.org/Homeownership/for%20Homebuyers/Homebuyer%20Mortgage%20Programs/Section8HomeownershipVoucherProgram.aspx
- http://www.hudoig.gov/report-fraud
Republished with permission under license from WikiHow.